Is St. Georges tap water safe to drink?
- Red Lion CCD, DE
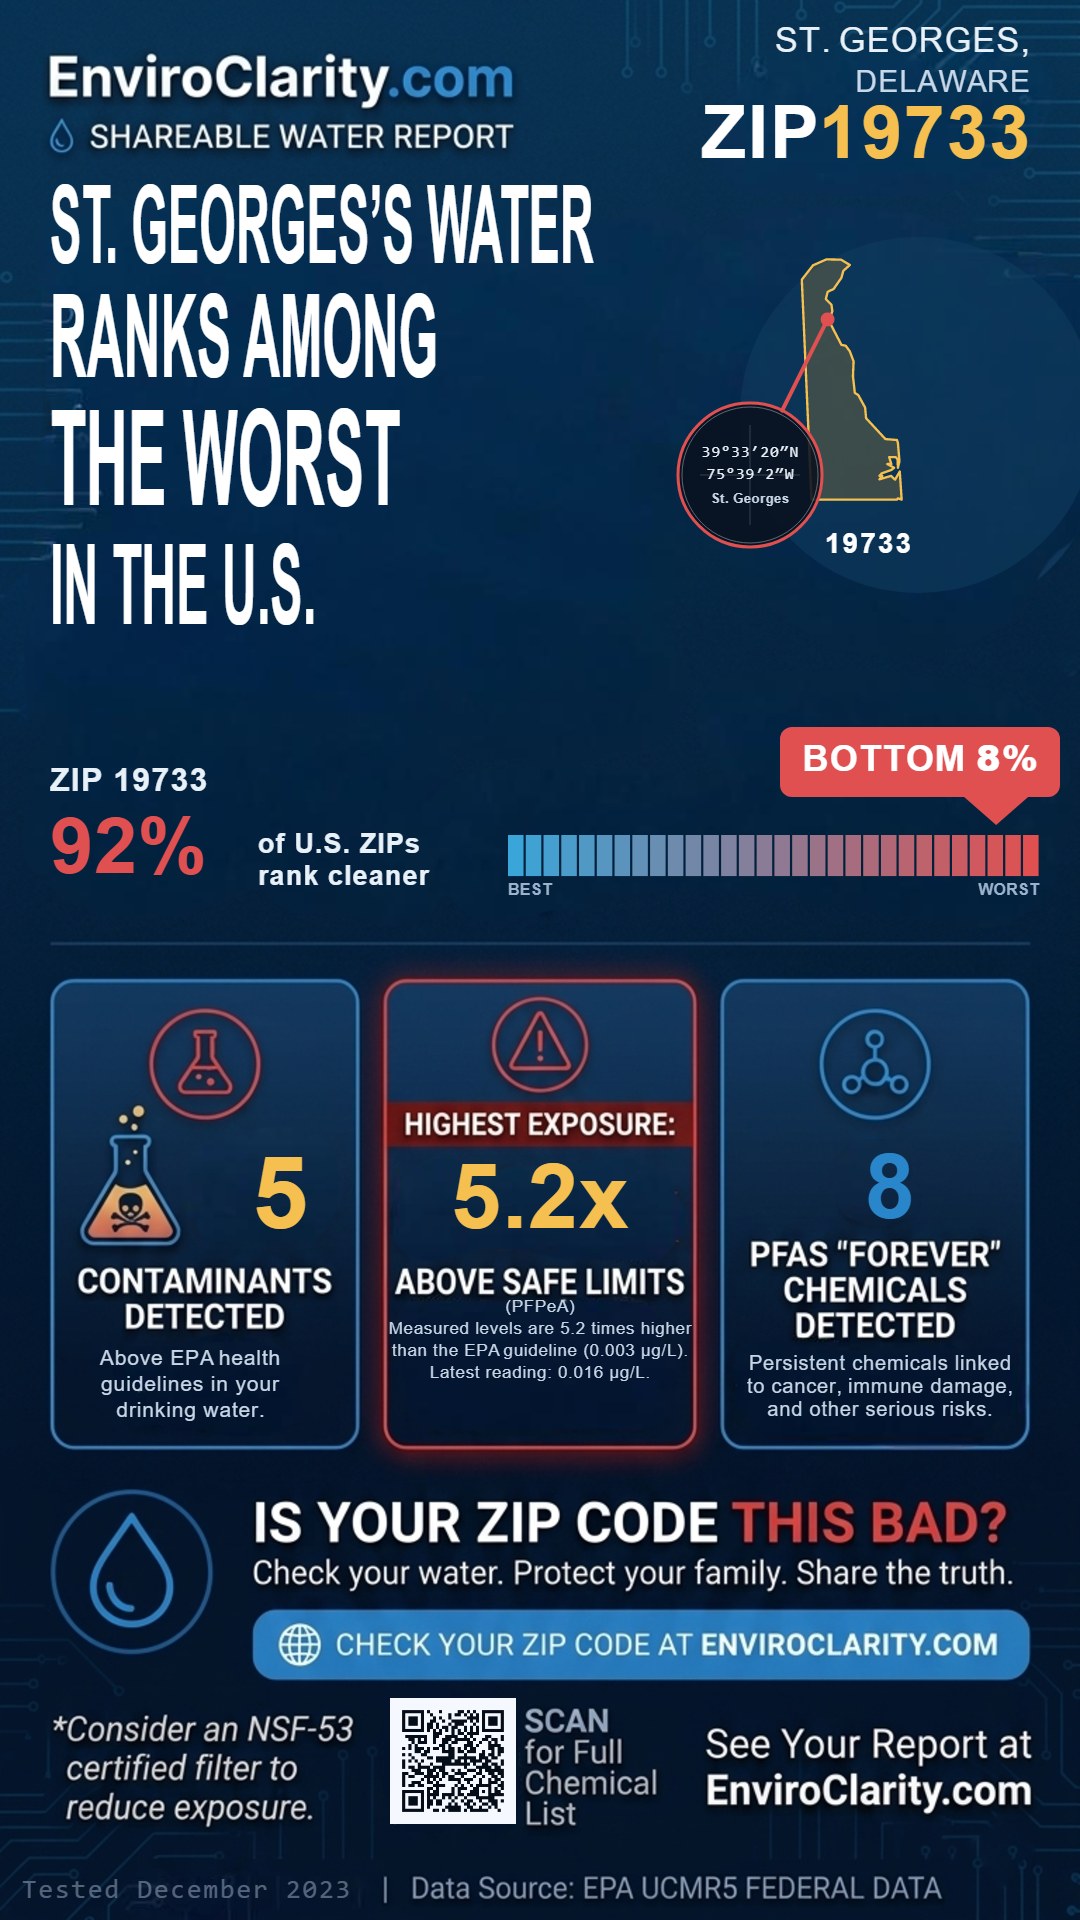
- Saint Georges, DE
The short answer for St. Georges
St. Georges tap water has 10 contaminants above EPA guidelines, including PFPeA at 5.2× the limit (tested December 2023). See the full compound-by-compound breakdown and filter recommendations.
The health risk for St. Georges
- PFDA, PFHpA, PFOA, PFPeA, PFUnA above limit.
PFPeA (a PFAS 'forever chemical') was detected above EPA limits. These filters are independently certified to reduce common drinking-water contaminants.
Here's what actually removes PFAS from your water
The right filter eliminates PFAS at the tap. But not all filters do - and the type you choose matters for your home.
Common pitchers like Brita do not remove PFAS. You need a filter independently certified to NSF P473 (for pitcher filters) or NSF/ANSI 58 (for reverse osmosis systems). All three options below carry the relevant certification.
| Compound | Measurement | EPA Limit | Comparison |
|---|---|---|---|
| PFPeA Tested: December 2023 · Stanton Plant- North |
0.016 µg/L | 0.003 µg/L | 423% above limit |
| PFPeA Tested: December 2023 · Stanton Plant- South |
0.015 µg/L | 0.003 µg/L | 417% above limit |
| PFHpA Tested: December 2023 · Stanton Plant- South |
0.012 µg/L | 0.003 µg/L | 290% above limit |
| PFHpA Tested: December 2023 · Stanton Plant- North |
0.011 µg/L | 0.003 µg/L | 273% above limit |
| PFOA Tested: December 2023 · Stanton Plant- North |
0.013 µg/L | 0.004 µg/L | 238% above limit |
View all tested compounds
Stanton Plant- North · Tested: Multiple dates
| Compound | Measurement | EPA Limit | Comparison |
|---|---|---|---|
| PFPeA | 0.016 µg/L | 0.003 µg/L | 423% above limit |
| PFHpA | 0.011 µg/L | 0.003 µg/L | 273% above limit |
| PFOA | 0.013 µg/L | 0.004 µg/L | 238% above limit |
| PFUnA | 0.003 µg/L | 0.002 µg/L | 70% above limit |
| PFDA | 0.005 µg/L | 0.003 µg/L | 57% above limit |
| PFNA | 0.007 µg/L | 0.01 µg/L | 75% of limit |
| PFHxA | 0.014 µg/L | 3 µg/L | 0.5% of limit |
| PFBA | 0.024 µg/L | 6 µg/L | 0.4% of limit |
| lithium | <9.000 µg/L | 10 µg/L | Below limit |
| PFHxS | <0.003 µg/L | 0.004 µg/L | Below limit |
| HFPO-DA | <0.005 µg/L | 0.01 µg/L | Below limit |
| 11Cl-PF3OUdS | <0.005 µg/L | 0.005 µg/L | Below limit |
| 4:2 FTS | <0.003 µg/L | 0.003 µg/L | Below limit |
| 6:2 FTS | <0.005 µg/L | 0.005 µg/L | Below limit |
| 8:2 FTS | <0.005 µg/L | 0.005 µg/L | Below limit |
| 9Cl-PF3ONS | <0.002 µg/L | 0.002 µg/L | Below limit |
| ADONA | <0.003 µg/L | 0.003 µg/L | Below limit |
| PFBS | <0.003 µg/L | 0.003 µg/L | Below limit |
| PFDoA | <0.003 µg/L | 0.003 µg/L | Below limit |
| PFHpS | <0.003 µg/L | 0.003 µg/L | Below limit |
| PFOS | <0.004 µg/L | 0.004 µg/L | Below limit |
| PFTrDA | <0.007 µg/L | 0.007 µg/L | Below limit |
Stanton Plant- South · Tested: Multiple dates
| Compound | Measurement | EPA Limit | Comparison |
|---|---|---|---|
| PFPeA | 0.015 µg/L | 0.003 µg/L | 417% above limit |
| PFHpA | 0.012 µg/L | 0.003 µg/L | 290% above limit |
| PFOA | 0.013 µg/L | 0.004 µg/L | 235% above limit |
| PFUnA | 0.004 µg/L | 0.002 µg/L | 90% above limit |
| PFDA | 0.005 µg/L | 0.003 µg/L | 53% above limit |
| PFNA | 0.008 µg/L | 0.01 µg/L | 83% of limit |
| PFHxA | 0.015 µg/L | 3 µg/L | 0.5% of limit |
| PFBA | 0.024 µg/L | 6 µg/L | 0.4% of limit |
| lithium | <9.000 µg/L | 10 µg/L | Below limit |
| PFHxS | <0.003 µg/L | 0.004 µg/L | Below limit |
| HFPO-DA | <0.005 µg/L | 0.01 µg/L | Below limit |
| 11Cl-PF3OUdS | <0.005 µg/L | 0.005 µg/L | Below limit |
| 4:2 FTS | <0.003 µg/L | 0.003 µg/L | Below limit |
| 6:2 FTS | <0.005 µg/L | 0.005 µg/L | Below limit |
| 8:2 FTS | <0.005 µg/L | 0.005 µg/L | Below limit |
| 9Cl-PF3ONS | <0.002 µg/L | 0.002 µg/L | Below limit |
| ADONA | <0.003 µg/L | 0.003 µg/L | Below limit |
| PFBS | <0.003 µg/L | 0.003 µg/L | Below limit |
| PFDoA | <0.003 µg/L | 0.003 µg/L | Below limit |
| PFHpS | <0.003 µg/L | 0.003 µg/L | Below limit |
| PFOS | <0.004 µg/L | 0.004 µg/L | Below limit |
| PFTrDA | <0.007 µg/L | 0.007 µg/L | Below limit |
Star Enterprise 1a · Tested: Multiple dates
| Compound | Measurement | EPA Limit | Comparison |
|---|---|---|---|
| Nitrate | 3.300 mg/L | 1E+04 mg/L | 0.0% of limit |
| Nitrate + Nitrite | 3.300 mg/L | 1E+04 mg/L | 0.0% of limit |
| Alkalinity, total | 94.400 mg/L | — | — |
| Ammonia-nitrogen | 0.010 mg/L | — | — |
| Calcium | 47100.000 µg/L | — | — |
| Chloride | 509.000 mg/L | — | — |
| Magnesium | 8870.000 µg/L | — | — |
| Nitrogen | 3.210 mg/L | — | — |
| Phosphorus | 0.014 mg/L | — | — |
| Potassium | 2130.000 µg/L | — | — |
| Silica | 6.800 mg/L | — | — |
| Sodium | 2940.000 µg/L | — | — |
| Sulfate | 12.400 mg/L | — | — |
| Total dissolved solids | 68.000 mg/L | — | — |
Water utilities serving ZIP 19733
Service area boundaries are approximate and based on state filings or modeled estimates. Contact your utility to confirm exact service at a specific address.
- ARTESIAN WATER COMPANYAction advised
Frequently Asked Questions about ZIP 19733 Tap Water
What contaminants are above EPA limits in ZIP 19733?
ZIP 19733 has 10 contaminants above EPA health guidelines in the latest available data, including PFPeA at 5.2x the EPA guideline. The full table on this page lists every tested compound and its measured level.
Will boiling ZIP 19733 tap water remove PFPeA?
No. Boiling does not remove PFAS, and the compounds can actually become more concentrated as water evaporates. To reduce PFAS at home, use a filter independently certified to NSF/ANSI P473 (activated-carbon pitcher or under-sink) or NSF/ANSI 58 (reverse osmosis).
Do basic pitcher filters remove PFPeA?
Most basic pitcher filters are only certified to NSF/ANSI 42 or 53, which do not cover PFAS. Look for a filter independently certified to NSF/ANSI P473 (activated-carbon pitcher or under-sink) or NSF/ANSI 58 (reverse osmosis) on the spec sheet.
Who provides tap water in ZIP 19733?
Public records identify ARTESIAN WATER COMPANY as a primary water system associated with ZIP 19733. Service boundaries can vary by address, so confirm exact service with the utility.
When was ZIP 19733 tap water last tested?
The most recent test date used in this report is December 2023. EnviroClarity last refreshed this page on 2026-05-05.
Where can I find the official water quality report for ZIP 19733?
Every U.S. public water system is required to publish an annual Consumer Confidence Report (CCR). Contact ARTESIAN WATER COMPANY or visit their website for the latest official report covering ZIP 19733. The EPA also maintains a national CCR locator.
Check another ZIP code
Nearby ZIP reports
Data reflects publicly reported utility records from EPA datasets and local utility disclosures. This information is educational and not medical advice.